The Power of Compound Interest
What is compound interest?
Compound interest is the interest on savings calculated on both the initial principal and the accumulated interest from previous periods. Because compound interest includes interest accumulated in previous periods, it grows at an ever-accelerating rate.
What could be
The chart below shows a $7,000 initial investment with $583 per month (amount needed to max a IRA in 2024), with 10% yearly interest. This is over the course of 40 years. This gives you a potential $3,413,192.31 by the time you retire and you only had to contribute $286,840.00. Now, if you are like me and do not have $7,000 for an initial deposit, you can start off slow like me with $583 a month. This maxes out your IRA each year. Using me as an example, I did mine for 30 years with $583 a month and this would potentially give you $1,160,973.18 with only $210,463.00 contributed.
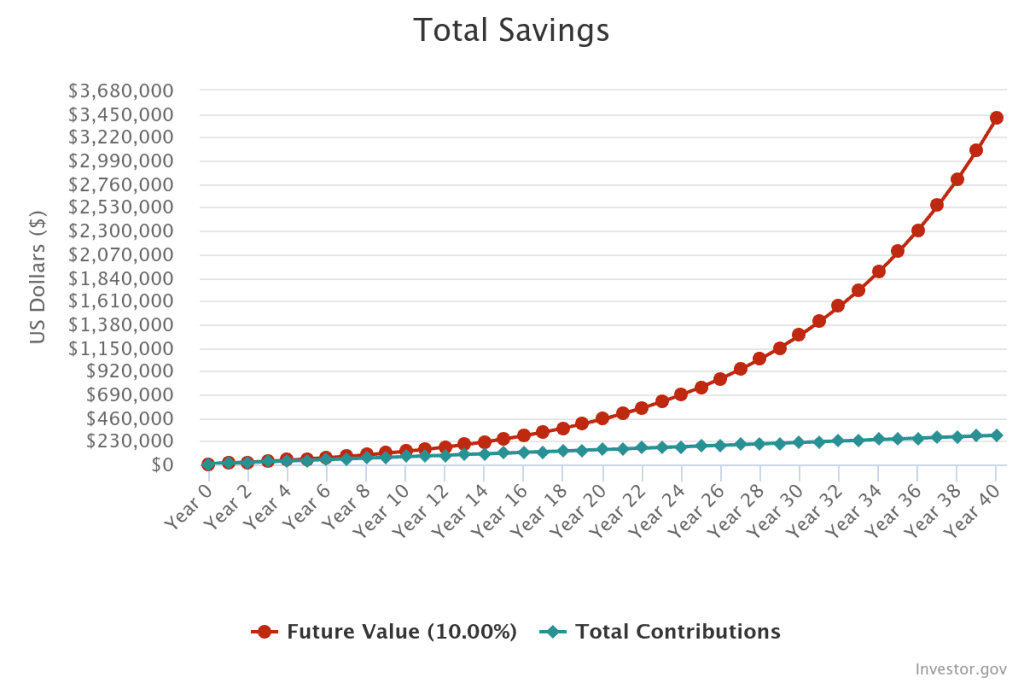
This chart breaks down the figure and helps you understand how each year would potentially look like. It is helpful to see this data as it gives you an idea of how your money is working for you. For example, let us look at year 1 which is $14,696.00 to year 5 which is $53,984.85. This is a difference of 114.41%. This jump is crazy! Compound interest is your friend.
| Years | Future Value (10.00%) | Total Contributions |
| Year 0 | $7,000.00 | $7,000.00 |
| Year 1 | $14,696.00 | $13,996.00 |
| Year 2 | $23,161.60 | $20,992.00 |
| Year 3 | $32,473.76 | $27,988.00 |
| Year 4 | $42,717.14 | $34,984.00 |
| Year 5 | $53,984.85 | $41,980.00 |
| Year 6 | $66,379.33 | $48,976.00 |
| Year 7 | $80,013.27 | $55,972.00 |
| Year 8 | $95,010.59 | $62,968.00 |
| Year 9 | $111,507.65 | $69,964.00 |
| Year 10 | $129,654.42 | $76,960.00 |
| Year 11 | $149,615.86 | $83,956.00 |
| Year 12 | $171,573.45 | $90,952.00 |
| Year 13 | $195,726.79 | $97,948.00 |
| Year 14 | $222,295.47 | $104,944.00 |
| Year 15 | $251,521.02 | $111,940.00 |
| Year 16 | $283,669.12 | $118,936.00 |
| Year 17 | $319,032.03 | $125,932.00 |
| Year 18 | $357,931.24 | $132,928.00 |
| Year 19 | $400,720.36 | $139,924.00 |
| Year 20 | $447,788.40 | $146,920.00 |
| Year 21 | $499,563.24 | $153,916.00 |
| Year 22 | $556,515.56 | $160,912.00 |
| Year 23 | $619,163.12 | $167,908.00 |
| Year 24 | $688,075.43 | $174,904.00 |
| Year 25 | $763,878.97 | $181,900.00 |
| Year 26 | $847,262.87 | $188,896.00 |
| Year 27 | $938,985.15 | $195,892.00 |
| Year 28 | $1,039,879.67 | $202,888.00 |
| Year 29 | $1,150,863.64 | $209,884.00 |
| Year 30 | $1,272,946.00 | $216,880.00 |
| Year 31 | $1,407,236.60 | $223,876.00 |
| Year 32 | $1,554,956.26 | $230,872.00 |
| Year 33 | $1,717,447.88 | $237,868.00 |
| Year 34 | $1,896,188.67 | $244,864.00 |
| Year 35 | $2,092,803.54 | $251,860.00 |
| Year 36 | $2,309,079.89 | $258,856.00 |
| Year 37 | $2,546,983.88 | $265,852.00 |
| Year 38 | $2,808,678.27 | $272,848.00 |
| Year 39 | $3,096,542.10 | $279,844.00 |
| Year 40 | $3,413,192.31 | $286,840.00 |
Looking to stay in the know? Check out these 6 Exceptional Investment Newsletters